
The top 10 most dangerous cities in America, ranked by FBI violent crime rate per 100,000 residents, are Memphis, Oakland, St. Louis, Detroit, Little Rock, Baltimore, Cleveland, Jackson, New Orleans, and Birmingham. Rates range from roughly 1,400 to over 2,500 per 100,000, well above the national average of 359.1.
Top 10 Most Dangerous Cities in America

If you’re planning a move, a road trip, or a study-abroad semester in the United States, you’ve probably typed some version of “most dangerous cities in America” into a search bar. It’s a fair question. Crime data is public, it’s measurable, and it genuinely affects where people choose to live, visit, and raise families.
This guide pulls together the most recent, publicly verifiable data from the FBI Crime Data Explorer, the Council on Criminal Justice, the U.S. Census Bureau, and local police departments to build a clear, honest picture of the ten U.S. cities with the highest violent crime rates right now.
We’re not here to scare anyone off American travel or relocation plans. Millions of people visit and live in every city on this list every year without incident. But context matters, and so does preparation. This article gives you both.
One thing to keep in mind before you keep reading: a citywide crime statistic is an average. It blends the safest blocks with the most difficult ones. We’ll break down exactly what that means for each city, neighborhood by neighborhood, so you can make informed decisions rather than reacting to a headline number.
Quick Verdict
Memphis, Tennessee currently holds the highest violent crime rate among major U.S. cities, at roughly 2,500 incidents per 100,000 residents , about seven times the national average. Oakland, St. Louis, Detroit, and Baltimore round out a group of cities where violent crime rates are three to five times the national figure.
The encouraging part of this story is often left out of “most dangerous” lists: nearly every city here has seen meaningful year-over-year declines in homicide and violent crime since 2021-2023. Several are reporting their lowest murder counts in 20 to 50 years. High crime rates and improving trends can both be true at once, and that nuance matters if you’re trying to make a real decision about visiting or moving.
How We Ranked These Cities
This ranking is built primarily around the violent crime rate per 100,000 residents, which includes murder and non-negligent manslaughter, rape, robbery, and aggravated assault, following FBI Uniform Crime Reporting (UCR) definitions.
We used this metric instead of raw crime counts because it standardizes cities of very different sizes. A city of 3 million and a city of 150,000 can’t be compared fairly using total incidents alone.
Here’s the methodology in plain terms:
- Primary data source: FBI Crime Data Explorer and FBI Uniform Crime Reporting (UCR) figures, primarily 2024 data, the most recent full annual release available.
- Population threshold: Cities generally needed a population above 100,000–200,000 to be included, avoiding statistical noise from very small cities where a handful of incidents can produce extreme per-capita rates.
- Supplementary sources: Council on Criminal Justice year-end crime trend reports, U.S. Census Bureau population estimates, and individual police department year-end statistics were used to cross-check and add 2025 trend context.
- Property crime: Excluded from the core ranking, since it poses a lower direct risk to personal safety, though we reference it where it’s especially relevant (for example, vehicle theft in Oakland).
- Known limitation: The FBI’s transition to the National Incident-Based Reporting System (NIBRS) created reporting gaps between 2021 and 2023, as some agencies didn’t submit complete data. We prioritized cities with consistent, verifiable reporting.
It’s worth noting that the FBI itself, and organizations like the American Society of Criminology, caution against using UCR data to create simplistic city rankings, since crime is shaped by many local factors beyond policing. We include this ranking because it answers a real, common search question, but we’d encourage you to read it as a snapshot, not a permanent verdict on any city or its residents.
Top 10 Most Dangerous Cities in America (Quick List)
- Memphis, Tennessee
- Oakland, California
- St. Louis, Missouri
- Detroit, Michigan
- Little Rock, Arkansas
- Baltimore, Maryland
- Cleveland, Ohio
- Jackson, Mississippi
- New Orleans, Louisiana
- Birmingham, Alabama
Detailed Analysis: City #1 , Memphis, Tennessee

Memphis currently reports the highest violent crime rate of any large U.S. city, at approximately 2,500 per 100,000 residents according to recent FBI data , more than six times the national average of 359.1.
The city has also become a genuine case study in rapid improvement. Memphis Police Department year-end reporting points to roughly a 26–30% drop in homicides through 2024–2025, alongside declines in aggravated assaults, robberies, and carjackings. Crime in several major categories reportedly fell to a 25-year low.
Higher-crime areas tend to cluster in Whitehaven, Orange Mound, and Frayser, where property crime rates are especially elevated. Meanwhile, neighborhoods like Downtown’s core tourist strip, Cooper-Young, and East Memphis see far lower incident rates and heavy foot traffic from residents and visitors alike.
Bottom line: Memphis is a city of extremes , some of the country’s highest violent crime figures, paired with some of the country’s fastest recent improvement.
Detailed Analysis: City #2 , Oakland, California

Oakland’s violent crime rate sits around 1,925 per 100,000 residents, roughly five times the national average, and the city also leads major U.S. cities in property crime, with a rate near 7,230 per 100,000.
Vehicle theft and organized retail theft have been particularly persistent problems, prompting several national retailers to close Oakland storefronts in recent years. That said, homicide numbers tell a more encouraging story: Oakland recorded 67 homicides in 2025, a roughly 22% decline from the prior year and its lowest total since 1967.
Visitors and residents generally report feeling safest in Rockridge, Piedmont Avenue, and the Lake Merritt area, while parts of East Oakland and West Oakland carry a disproportionate share of violent incidents.
Detailed Analysis: City #3 , St. Louis, Missouri

St. Louis has one of the highest murder rates of any mid-sized American city, historically near 48–54 per 100,000 residents, alongside an overall violent crime rate estimated around 1,860 per 100,000 , nearly five times the national figure.
The encouraging trend: the city’s homicide rate has declined roughly 30% from its 2019 peak. Much of the remaining violent crime is concentrated in specific north St. Louis neighborhoods, while the Central West End, Clayton border areas, and the Delmar Loop see substantially lower crime rates and remain popular with students and young professionals.
Detailed Analysis: City #4 , Detroit, Michigan
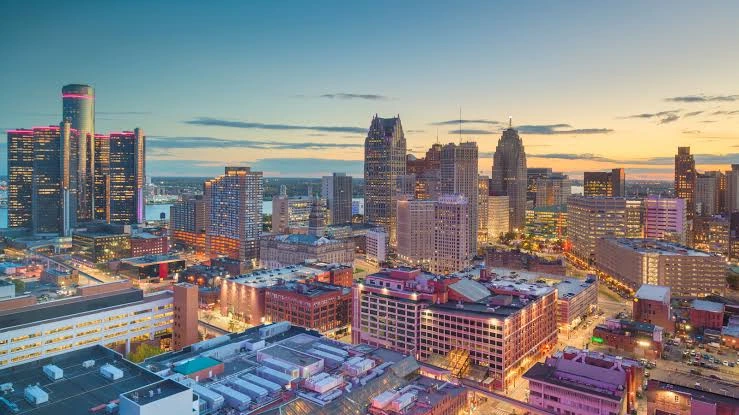
Detroit’s violent crime rate is reported at roughly 1,780 per 100,000 residents, more than triple the national average. Detroit has struggled with high violent crime for decades, tied closely to population loss, deindustrialization, and long-term disinvestment in specific neighborhoods.
At the same time, Detroit has invested heavily in a citywide camera and gunshot-detection network (Project Green Light), and local police reporting has shown gradual, multi-year declines in homicide. Downtown, Midtown, and Corktown , the areas most visited by tourists and new residents , generally report far lower crime rates than the city’s east-side residential neighborhoods.
Detailed Analysis: City #5 , Little Rock, Arkansas

Little Rock’s violent crime rate is estimated near 1,670 per 100,000 residents. Unlike several cities on this list, Little Rock actually saw a concerning increase recently , local reporting cited a roughly 16% rise in homicides in 2025 compared with the year before, with 37–44 homicides depending on the reporting period.
Higher-crime activity tends to concentrate in specific south and southwest Little Rock neighborhoods, while the Heights, Hillcrest, and the River Market entertainment district report comparatively low incident rates.
Detailed Analysis: City #6 , Baltimore, Maryland

Baltimore’s violent crime rate is roughly 1,600 per 100,000 residents, more than triple the U.S. average. Baltimore’s crime story in the past two years has actually been one of the more dramatic turnarounds in the country , local reporting and NPR coverage both point to a sharp, sustained drop in homicides through 2025, continuing a multi-year decline from the city’s earlier peaks.
Crime remains heavily concentrated in a relatively small number of West and East Baltimore neighborhoods, while Fells Point, Federal Hill, Canton, and the Inner Harbor tourist core see dramatically lower rates and heavy year-round visitor traffic.
Detailed Analysis: City #7 , Cleveland, Ohio

Cleveland’s violent crime rate is estimated around 1,560 per 100,000 residents. The city recorded 108 homicides in 2025, an 11.5% decrease from 122 the year before, with rapes, robberies, and aggravated assaults also declining.
Community policing partnerships and coordination through the Major Cities Chiefs Association have been credited with part of the improvement. Ohio City, Tremont, and Downtown’s entertainment core generally see far less violent crime than several east-side residential neighborhoods.
Detailed Analysis: City #8 , Jackson, Mississippi
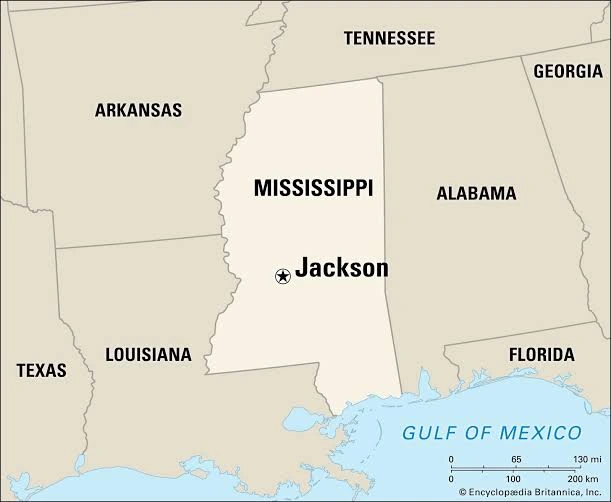
Jackson stands out less for its overall violent crime rate and more for having one of the highest per-capita homicide rates of any U.S. city with a population above 130,000 , recent estimates put it above 50 per 100,000, more than ten times the national homicide rate.
Jackson’s challenges are compounded by a smaller population base, meaning each individual homicide has an outsized effect on the per-capita rate. Local and state resources have been directed toward the city in recent years, though progress has been slower and less consistent than in some larger cities on this list.
Detailed Analysis: City #9 , New Orleans, Louisiana
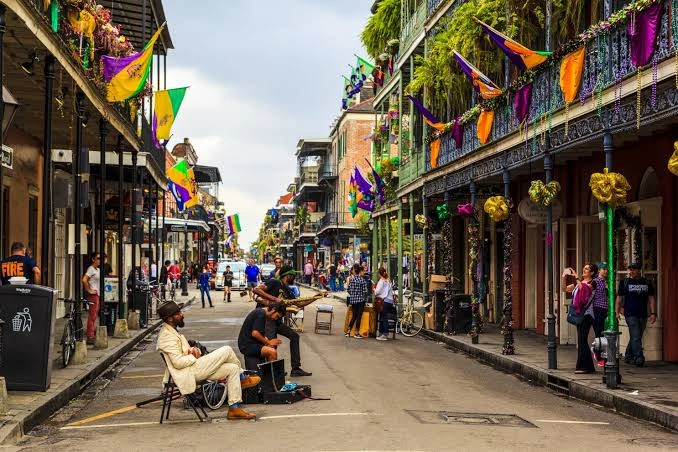
New Orleans was once labeled the “murder capital” of the U.S. in 2022, with 266 homicides that year. By 2025, that number had fallen to roughly 107 , a 55% reduction and a 50-year low , with armed robberies down about 70% over the same period.
The city also carries a specific, well-known trauma: on New Year’s Day 2025, a domestic terror attack on Bourbon Street killed 14 people and injured dozens more, an event confirmed by the FBI and covered extensively by national media. It’s a stark reminder that isolated, high-profile incidents can shape a city’s reputation independently of its statistical trend , and that trend, in New Orleans’s case, has been a genuine multi-year improvement.
The French Quarter, Garden District, and Uptown remain heavily trafficked by tourists and generally report lower rates than several residential neighborhoods further from the river.
Detailed Analysis: City #10 , Birmingham, Alabama

Birmingham has appeared on national “most dangerous cities” lists for years due to a violent crime rate that regularly runs three to four times the national average, driven in large part by a persistently high homicide rate relative to its population size.
As with most cities on this list, crime is not evenly distributed. Downtown’s revitalized core, along with neighborhoods like Homewood-adjacent areas and Forest Park, see meaningfully lower rates than parts of the city’s west side.
Crime Comparison Table
| Rank | City | Violent Crime Rate (per 100,000) | vs. National Average (359.1) | Recent Trend |
| 1 | Memphis, TN | ~2,500 | ~7x | Improving (homicides down ~26-30%) |
| 2 | Oakland, CA | ~1,925 | ~5x | Improving (lowest homicides since 1967) |
| 3 | St. Louis, MO | ~1,860 | ~5x | Improving (down ~30% from 2019 peak) |
| 4 | Detroit, MI | ~1,780 | ~5x | Gradually improving |
| 5 | Little Rock, AR | ~1,670 | ~4.6x | Worsening (homicides up ~16% in 2025) |
| 6 | Baltimore, MD | ~1,600 | ~4.5x | Sharply improving |
| 7 | Cleveland, OH | ~1,560 | ~4.3x | Improving |
| 8 | Jackson, MS | High homicide rate (~53/100k) | ~10x (homicide) | Mixed / slow progress |
| 9 | New Orleans, LA | Historically high, improving sharply | N/A | Strongly improving (50-year low murders) |
| 10 | Birmingham, AL | ~3-4x national average | ~3-4x | Stable, slow improvement |
Figures are drawn from FBI Crime Data Explorer and UCR reports (2024), Council on Criminal Justice year-end updates, and individual police department year-end statistics. Rates are approximate and reflect the most recent full-year comparable data available at time of writing.
Why These Cities Have Higher Crime Rates
There’s no single explanation, and researchers at the Bureau of Justice Statistics and Council on Criminal Justice generally point to a combination of overlapping factors rather than any one cause:
- Concentrated poverty: Many of these cities have specific neighborhoods with poverty rates well above the national average, which correlates strongly with higher violent crime in criminological research.
- Population loss and disinvestment: Detroit, St. Louis, and Baltimore have all lost significant population since the mid-20th century, leaving behind vacant housing stock and reduced tax bases for public services.
- Firearm availability: States with higher rates of gun ownership and looser firearm regulations tend to see higher rates of gun-involved homicide, a pattern documented across multiple public health studies.
- Under-resourced police departments: Several cities on this list, including New Orleans, have operated with historically low numbers of commissioned officers relative to population.
- Reporting and data factors: Smaller cities can show extreme per-capita rates from a relatively small number of incidents, which is why population thresholds matter in any ranking.
It’s worth repeating: high crime rates are not evenly distributed across a city’s population or geography. They tend to cluster tightly in a small number of neighborhoods shaped by decades of specific economic and policy conditions.
Safest Neighborhoods and Areas to Visit
This is arguably the most useful section for travelers. Below are commonly cited lower-crime areas within each city, based on local police precinct data and neighborhood-level crime reporting.
| City | Generally Safer Areas |
| Memphis | Downtown core, Cooper-Young, East Memphis |
| Oakland | Rockridge, Piedmont Avenue, Lake Merritt |
| St. Louis | Central West End, Clayton border, Delmar Loop |
| Detroit | Downtown, Midtown, Corktown |
| Little Rock | Hillcrest, the Heights, River Market district |
| Baltimore | Fells Point, Federal Hill, Canton, Inner Harbor |
| Cleveland | Ohio City, Tremont, Downtown entertainment district |
| Jackson | Fondren, Downtown business district (daytime) |
| New Orleans | French Quarter, Garden District, Uptown |
| Birmingham | Downtown core, Forest Park, Lakeview district |
These areas are not crime-free , no urban neighborhood is , but they consistently report lower incident rates than the citywide average and see the heaviest tourist and student foot traffic.
Safety Tips for Travelers, Students, and Families
- Research at the neighborhood level. Tools like local police department crime maps and CrimeGrade.org can show block-by-block data rather than citywide averages.
- Stay in well-trafficked, well-lit areas after dark. Most violent incidents in these cities cluster in specific corridors and late-night hours.
- Use rideshare or transit rather than walking long distances at night. Nearly every safety thread on local subreddits repeats this advice.
- Keep valuables out of sight in parked vehicles. Vehicle break-ins and theft remain a leading property crime category in several of these cities.
- Share your location with someone you trust if you’re traveling solo, especially at night.
- For students: check whether your university offers a campus safety escort service, and prioritize on-campus or university-affiliated housing in your first year.
- For families relocating: visit prospective neighborhoods at different times of day before committing to a lease or purchase, and talk to current residents if possible.
- Trust local knowledge over headlines. Residents typically know which specific blocks to avoid far better than any national ranking can capture.
Most Dangerous Cities vs. Safest Cities in America
For context, it helps to see the other end of the spectrum. Carmel, Indiana currently holds one of the lowest violent crime rates of any U.S. city with a population above 100,000, at roughly 66 per 100,000 , nearly 38 times lower than Memphis’s rate. Irvine, California and Gilbert, Arizona also report violent crime rates below 100 per 100,000.
| Category | Most Dangerous Example | Safest Example |
| Violent crime rate | Memphis (~2,500/100k) | Carmel, IN (~66/100k) |
| Homicide rate | Jackson, MS (~53/100k) | Below 2/100k in many safe suburbs |
| Typical profile | Larger legacy industrial cities | Planned suburban communities |
Interestingly, New York City , long associated with a dangerous reputation in popular culture , reported a violent crime rate of roughly 280 per 100,000 in 2024, ranking 32nd nationally among large cities and sitting below the national average. Reputation and current statistics don’t always align.
Common Myths About Crime in America
- Myth: A city’s crime rate applies evenly everywhere within it. In reality, crime is heavily concentrated. Tourist and downtown districts in high-crime cities often report rates 40–70% lower than the citywide average.
- Myth: Big cities are always more dangerous than small towns. Some of the highest per-capita rates in the country belong to mid-sized cities like Little Rock and Jackson, not the largest metros.
- Myth: Crime in America is at an all-time high. The opposite is closer to true nationally , the 2024 national violent crime rate was the lowest in roughly two decades, and homicides across large cities fell sharply through 2025.
- Myth: A dangerous reputation always reflects current data. New York City’s current violent crime rate is below the national average, despite decades-old perceptions.
- Myth: Crime rankings are official government lists. The FBI does not publish “most dangerous city” rankings and has explicitly cautioned against using its raw data this way, since local context is easily lost.
Final Verdict
Every city on this list has real, measurable challenges with violent crime, and that data deserves to be taken seriously by anyone planning to live in, study in, or visit them.
At the same time, the bigger and more useful story for 2026 is one of improvement. Most of these cities are seeing meaningful declines in homicide and violent crime, some hitting multi-decade lows. None of that erases the risk in specific neighborhoods, but it does mean a citywide label from a few years ago may already be out of date.
If you’re planning a trip, a move, or a semester abroad, the smartest approach is the same in every case: look past the headline ranking, check current neighborhood-level data, and lean on practical safety habits rather than avoidance of entire cities.
FAQ Section
What is the most dangerous city in America right now?
Memphis, Tennessee currently has the highest violent crime rate among major U.S. cities, at roughly 2,500 per 100,000 residents, based on FBI data.
Is it safe to visit these cities as a tourist?
Yes, in general. Tourist districts in these cities typically report significantly lower crime rates than citywide averages, and millions of visitors travel to them safely every year.
How is “most dangerous” actually measured?
Most rankings, including this one, use the violent crime rate per 100,000 residents, based on FBI UCR data covering murder, rape, robbery, and aggravated assault.
Does the FBI publish an official “most dangerous cities” list?
No. The FBI provides raw crime data through its Crime Data Explorer but does not rank cities, and it has cautioned against using its data this way due to local context that gets lost in simple rankings.
Is crime in America getting worse or better?
Nationally, better. The 2024 violent crime rate was the lowest in roughly 20 years, and homicides across many large cities continued falling through 2025.
Which U.S. city has the highest murder rate specifically?
Jackson, Mississippi currently has one of the highest per-capita homicide rates of any U.S. city with a population above 130,000, at an estimated 53+ per 100,000.
Are safer neighborhoods really that different from dangerous ones in the same city?
Yes, often dramatically. Crime rates can vary more than tenfold between the safest and most dangerous neighborhoods within a single city.
Should families avoid these cities entirely when relocating?
Not necessarily. Many families live safely and happily in specific low-crime neighborhoods within these cities. Neighborhood-level research matters far more than a citywide label.
What’s the safest large city in America?
Among cities with 100,000+ residents, Carmel, Indiana currently reports the lowest violent crime rate, at roughly 66 per 100,000.
Is New York City still considered dangerous?
Based on current data, no. NYC’s violent crime rate is below the national average and ranks well outside the top 30 most dangerous large U.S. cities.
How often does this kind of ranking change?
Annually, at minimum, since the FBI releases updated UCR data each year. Rankings can shift meaningfully year to year as cities implement new policing strategies or face new challenges.
Where can I check current crime data myself?
The FBI Crime Data Explorer, local police department websites, and the Council on Criminal Justice’s year-end crime trend reports are all free, publicly available sources.
Final Words
Crime statistics are a useful tool, but they work best as a starting point rather than a final answer. The ten cities on this list all carry real, elevated violent crime rates backed by FBI and local police data , but nearly all of them are also improving, and every one has neighborhoods where residents and visitors live and travel safely every day.
Whether you’re booking a trip, planning a move, or just researching for a school project, the healthiest approach is the same: use the data, check the neighborhood specifics, follow sensible safety habits, and avoid letting an outdated reputation make the decision for you.